
There’s no shying away from it: pesticide exposure is a hot topic for beekeepers and honey bee researchers alike. Since 2011, the National Honey Bee Survey (NHBS) has conducted in-hive sampling for pesticides analysis. As you can imagine, our database has become quite robust, including 10 years of apiary pesticide detections.
Last year, a subset of these data (2011-2017) were analyzed and published in Environmental Pollution in an article titled “Pesticides in Honey Bee Colonies: establishing a baseline for real world exposure over seven years in the USA” by Traynor et al. We discussed the article in webinar format last year, but I think this paper is worthy of further mention.
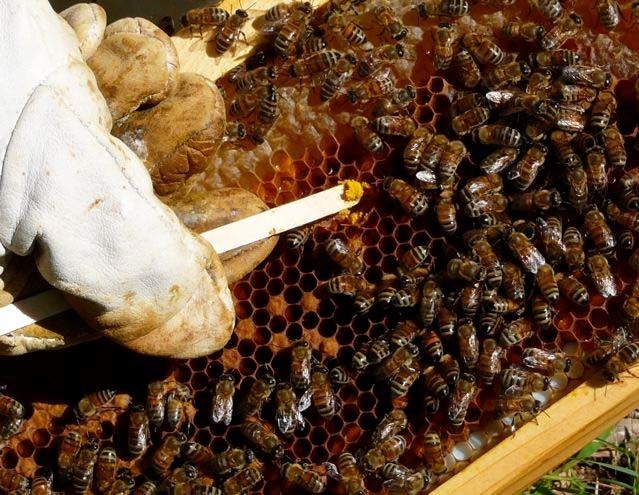
The pesticide residue data used for this publication were derived from pollen samples for the NHBS survey. Honey bees travel 2–6 km to forage for pollen (and nectar). It is their major source of protein and what they feed to developing brood, but it is also one of the most common ways they are exposed to pesticides. For these reasons, taking a sample of stored pollen from within hives and analyzing it is a good measure of what pesticides a colony may be consuming.
The pollen samples used for this analysis were taken by state apiary inspectors or university researchers who participated in the National Honey Bee Survey from 2011-2017. This equates to 1,055 samples taken in 39 states and Puerto Rico. Samples taken for the survey are composite, in which a small amount of pollen was taken from 8 colonies and combined into an approximately 3 gram sample. Therefore, each sample is representative of an apiary’s pesticide exposure. Samples were then shipped to the USDA AMS National Science Laboratory in Gastonia, NC where they were screened for ~200 different pesticides or pesticide metabolites.
Traynor et al. used these data to calculate risk in 5 different ways:
- Pesticide prevalence: the percentage of samples that tested positive for a pesticide.
- Pesticide diversity: the number of different pesticides detected.
- Pesticide concentration: the total concentration of all pesticides detected, measured in parts per billion (ppb).
- Significant pesticide prevalence: the number of pesticides that contributed equal 50 or more points to a sample’s total Hazard Quotient score.
- Hazard quotient (HQ): a risk assessment score, calculated from pesticides’ consumption LD50 (LD50 is the amount of pesticide fed to a test group of bees that results in 50% death) and pesticide concentration (ppb).
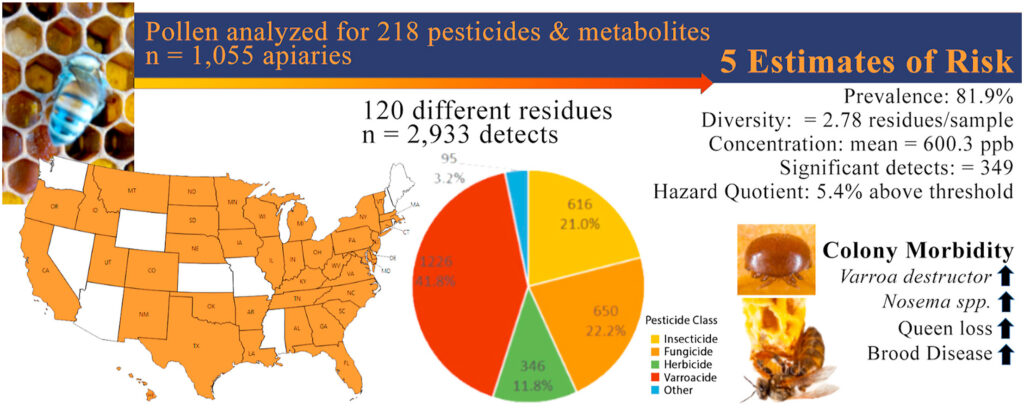
Out of the 218 pesticides screened, 120 were detected, and 81.9% of pollen samples had at least 1 detection. When the results were separated by pesticide class (fungicides, herbicides, insecticides and varroacides), insecticide prevalence decreased over the years studied, while fungicide and herbicide prevalence increased. Varroacides were more prevalent than any other pesticide class. Specifically, Amitraz (DMPF, the metabolite of Amitraz) was detected in 45.5% of samples, and thymol was found in 20.6% of samples. The pesticide diversity (of all classes) increased over time.
Pesticide concentration varied across states but not across years. New Jersey and New York had significantly higher pesticide concentrations. Fungicides were the largest contributor to pesticide concentration and varroacides were the second largest contributor; however, their concentration decreased significantly over time. Insecticides were in low concentration in comparison to varroacides, but they did significantly increase over time.
Pollen samples were labeled as high risk if they had a combined hazard quotient (HQ) over 1000, and 5.4% of samples exceeded this threshold. In fact, 12 different pesticides had individual HQ scores that were over 1000: chlorpyrifos, clothianidin, bifenthrin, carbaryl, prallethrin, thiamethoxam, cyfluthrin, fenpropathrin, permethrin, pyridaben, imidacloprid and coumaphos (all of these pesticides are insecticides except coumaphos which is a varroacide). Insecticides are the most toxic to bees and contributed the most to HQ scores compared to the other pesticide classes (fungicides, herbicides, and varroacides). Neonicotinoids were found in only 2% of samples, but when they were detected, they contributed drastically to the sample’s HQ score. Although varroacides were the most prevalent pesticides found in pollen samples, they contributed very little to samples’ total HQ scores.
Pesticide exposure was also compared with Varroa destructor loads, Nosema infection, and reports of queen problems. Varroacide diversity was higher in Varroa-free apiaries than in apiaries where Varroa was detected, which makes sense as beekeepers who manage and treat their colonies for Varroa have lower Varroa infestations. Furthermore, when concentrations of specific varroacides were analyzed, high concentrations of thymol and fluvalinate were detected in apiaries with high mite loads, possibly suggesting that recent application of varroacides were being used to treat colonies with Varroa beyond the damage threshold or that these treatments were not effective. And elevated concentrations of Amitraz (DMPF) and coumaphos were detected in apiaries with low mite loads. At face value, this suggests that thymol and fluvalinate are less effective than Amitraz and coumaphos at reducing mite infestation. Or it could be that thymol and fluvalinate take longer to kill mites, versus Amitraz and coumaphos that drop mites much more quickly. While we do not precisely know why we are seeing these correlations, this demonstrates the complications of pesticide analysis and creating a need for further research. In fact, we have plans to research the connection between varroacide concentrations in wax and varroacide resistant genes in mites later this year.
Fungicide diversity, concentration and HQ scores were significantly higher in apiaries that tested positive for Nosema spores in comparison to apiaries that did not have Nosema. This supports previous research by Pettis et al. 2013, which found a significant increase in Nosema after colonies were exposed to fungicides in pollen. Apiaries that were experiencing queen issues also had significantly higher fungicide HQ scores.
In conclusion, this research does not have evidence to link pesticide exposure to colony losses. However, there may be reason to be concerned when pesticide exposure coincides with other risks to honey bee health (like Nosema and queen events). This research also identified specific high-risk pesticides that we should continue to monitor for (chlorpyrifos, carbaryl, bifenthrin, clothiandin, thriamethoxam, and prallethrin). Herbicides don’t appear to be a risk to honey bee health, but our pesticides screening does not include glyphosate due to differences in procedure (and glyphosate has been found to affect honey bee gut biota, Motta et al. 2018).
This publication expanded our knowledge by determining what level of pesticide exposure is typical for US apiaries and also when we should be concerned. Prior to the National Honey Bee Survey, little was known about honey bee health risk based on pesticides found in pollen. This is a major step forward in understanding how pesticide exposure affects colony health and has raised many questions that we intend to investigate in the future.
References:
Traynor, K., Tosi, S., Rennich, K., Steinhauer, N., Forsgren, E., Rose, R., Kunkel, G., Madella, S., Lopez, D., Eversole, H., Fahey, R., Pettis, J., Evans, J., and vanEngelsdorp, D. (2021) Pesticides in honey bee colonies: Establishing a baseline for real world exposure over seven years in the USA, Environmental Pollution, Volume 279, https://doi.org/10.1016/j.envpol.2021.116566
Pettis, J., Lichtenberg, E., Andree, M., Stitzinger, J., Rose, R., and vanEngelsdorp, D. (2013) Crop Pollination Exposes Honey Bees to Pesticides Which Alters Their Susceptibility to the Gut Pathogen Nosema cerana, PloS one, 8, https://doi.org/10.1371/journal.pone.0070182
Motta, E., Raymann, K., and Moran, N. (2018) Glyphosate perturbs the gut microbiota of honey bees, Proceedings of the National Academy of Sciences, 115, 10305-10310, https://doi.org/10.1073/pnas.1803880115